 Stories in Structure
The Value of Your Gaze
Have you ever wondered what you’re actually looking at when you look?
Have you ever wondered why someone would want to know what you’re looking at?
It’s no surprise anymore that our behavioural data is valuable. Roughly speaking, two worlds care most about where we direct our eyes. Scientists—from psychology and neuroscience to computer vision—study eye movements to understand how the brain consumes and digests information. Meanwhile, industry uses attention as a lever: advertisers, designers, retailers, game studios, and even car manufacturers want to know what people notice first and what they miss. One side seeks understanding; the other seeks influence.
What Do You See When You Look?
So what do you actually see when you look at an image? Do your eyes sweep from left to right, top to bottom? Do they lock onto whatever sits in the center? Are you selective? Or is your curiosity evenly spread across the whole image?
To explore this, here’s a small experiment. Look at the image below for five seconds and simply notice what your eyes settle on.

Figure 1. Image from Object and Semantic Images and Eye-tracking (OSIE) dataset.
Saliency
All of us look differently, so what caught your attention might be different from what someone else fixated on, but not that different — we all tend to focus on things that stand out: colour, luminance, pattern, or size. In scientific terms, whatever stands out in a scene and attracts attention has a property called saliency.
Saliency is often visualized using saliency maps. Intuitively, you can imagine multiple people looking at the same image and each fixation increasing a kind of “attention counter” around where it landed.
In practice, rather than incrementing single pixels, each fixation is turned into a small, blurred Gaussian blob, because eye movements are never perfectly precise. By adding these blobs from many viewers and normalizing the result, we obtain a heatmap showing which parts of the image were most likely to attract attention.
Go ahead and compare what regions you looked at with what other people’s eyes found attractive.
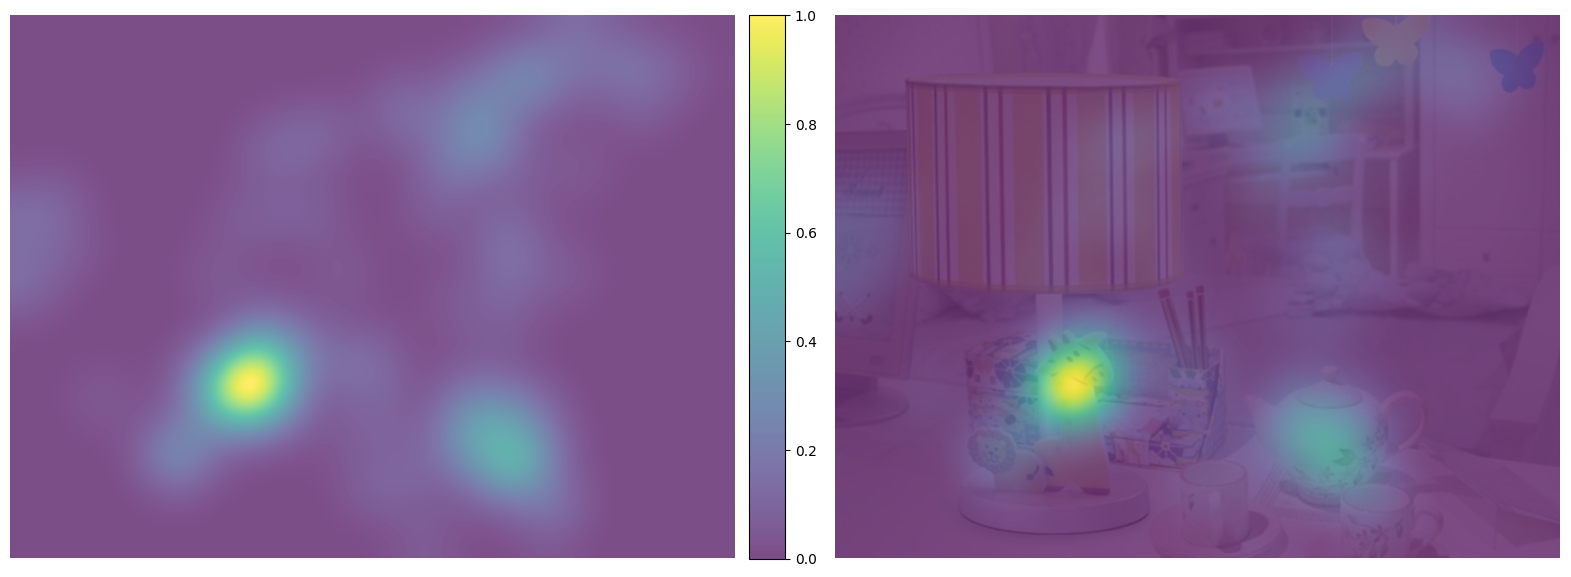
Figure 2. Left: saliency map. Right: the same saliency map overlaid on the original image.
Saliency tells us where people tend to look. But that’s not the whole story. You didn’t look at all these points at once. Your eyes travelled — one point at a time.
What you looked at formed a sequence.
Scanpath
While saliency is fairly universal, the sequence your eyes constructed while jumping from one interesting region to another is much more of a personal trait. These eye jumps are called saccades, and the points your eyes land on are fixations. Alternating fixations and saccades form a scanpath.
Below are two examples of such scanpaths.
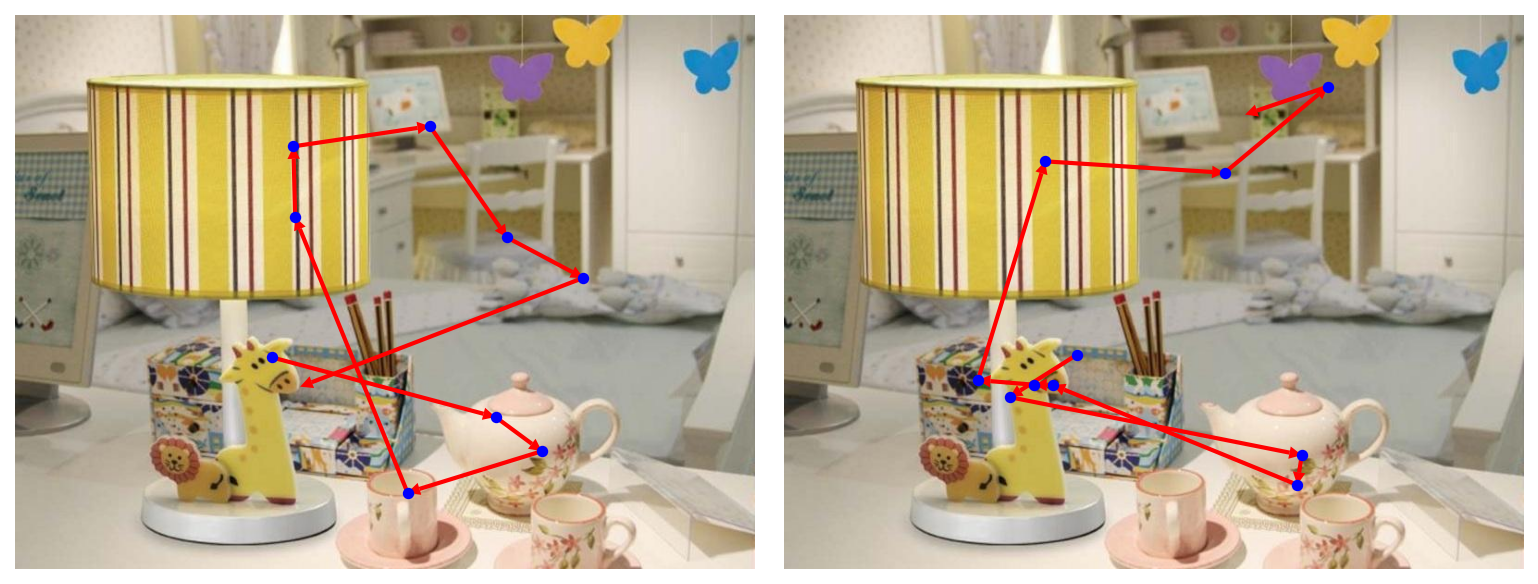
Figure 3. Examples of scanpaths from two different people on the same image.
We’ve seen something similar before.
Recall my post on climbing routes as path graphs. There, we looked at a graph where security bolts were nodes connected with a rope. Here we are also observing a graph, but this time every fixation is a node and every saccade is an edge joining two consecutive fixations. Unlike the debatable case of climbing routes, this time it is definitely a directed graph.
Interestingly, recent research shows that humans often return exactly to previous fixation locations (Kümmerer and Bethge 2021). In this light, the graph we observe is a directed graph that can include cycles.
Prediction
As I wrote at the beginning, two forces drive research on visual attention: science and industry. And both care for the same reason — our gaze is not random. It is structured. It can be measured, modeled, and, with the right tools, predicted.
From scanpaths to sequences
A scanpath isn’t just a collection of points — it’s a sequence. Each fixation depends on the ones before it, just as each step in a sentence depends on earlier words.
This is why predicting gaze is conceptually similar to how language models work:
given the context and the sequence so far, what comes next?
In text, the next element is a word.
In visual attention, the next element is a fixation.
From sequences to spatial graphs
But unlike text, scanpaths live in space. Every fixation is a node located somewhere in this space, and the saccades your eyes make form a directed graph through this space. Predicting attention, then, becomes a graph problem:
choose the next node, given the whole scene and the path so far.
This graph-based view lets us reason about attention as a spatial process — something language models don’t have to deal with.
Why this matters for shopping
Now consider what this means in the real world — especially in late November, when retailers run the world’s largest attention experiment. Saliency tells you what stands out, but it is your scanpath that determines which products you consider first, which you compare, and which you never see.
Retailers care because it affects revenue, but that’s only a narrow slice of what gaze enables. Our gaze is central to exploration, communication, navigation, coordination, and social connection. So, ultimately, what you look at is extremely powerful in almost every domain of life.
Summary
Your gaze leaves a trace: a directed graph constructed as your eyes traverse from one salient point to another. This graph can be learned, modeled, and predicted.
And that is precisely why your attention is valuable and in high demand.
So go enjoy letting your eyes wander across those Christmas presents!
Next time, we’ll see how Santa manages to deliver all of them down your chimney. Ho ho ho!
Further Reading
Scanpath prediction models
-
Yang, Zhibo, et al. “Unifying top-down and bottom-up scanpath prediction using transformers.” Proceedings of the IEEE/CVF Conference on Computer Vision and Pattern Recognition. 2024. [Article at CVPR 2024]
-
Li, Peizhao, et al. “UniAR: A Unified model for predicting human Attention and Responses on visual content.” Advances in Neural Information Processing Systems 37 (2024): 106346-106369. [Article at NeurIPS 2024]
-
Cartella, Giuseppe, et al. “Modeling Human Gaze Behavior with Diffusion Models for Unified Scanpath Prediction.” Proceedings of the IEEE/CVF International Conference on Computer Vision. 2025. [Article at ICCV 2025]
-
Kümmerer, Matthias, Matthias Bethge, and Thomas SA Wallis. “DeepGaze III: Modeling free-viewing human scanpaths with deep learning.” Journal of Vision 22.5 (2022): 7-7. [Article in Journal of Vision]
-
Kümmerer, Matthias, and Bethge, Matthias. “State-of-the-art in human scanpath prediction.” arXiv preprint arXiv:2102.12239 (2021). [Article on arXiv]
Consumer choice
-
van der Laan, Laura N., et al. “Do you like what you see? The role of first fixation and total fixation duration in consumer choice.” Food Quality and Preference 39 (2015): 46-55. [PDF]
-
Nordfält, Jens, and Carl-Philip Ahlbom. “Utilising eye-tracking data in retailing field research: A practical guide.” Journal of Retailing 100.1 (2024): 148-160. [Article in Journal of Retailing]
Saliency in Neuroscience
-
Foulsham, Tom, and Geoffrey Underwood. “What can saliency models predict about eye movements? Spatial and sequential aspects of fixations during encoding and recognition.” Journal of vision 8.2 (2008): 6-6. [Article in Journal of Vision]
-
Veale, Richard, Ziad M. Hafed, and Masatoshi Yoshida. “How is visual salience computed in the brain? Insights from behaviour, neurobiology and modelling.” Philosophical Transactions of the Royal Society B: Biological Sciences 372.1714 (2017): 20160113. [Article link]
OSIE Dataset
- Xu, Juan, et al. “Predicting human gaze beyond pixels.” Journal of vision 14.1 (2014): 28-28. [Article in Journal of Vision]