 Stories in Structure
Your Stories in Structure Wrapped 2025
Over the past year, I kept returning to one idea: the graph-like nature of how we think.
When we think, we don’t retrieve isolated facts — we follow associations between things. Take two seemingly unrelated ideas, like eye scanpaths (paths our eyes make when looking) and climbing routes. At first, they feel worlds apart.
But let your brain pursue the topic for a few milliseconds longer — and boom. You found an association, a common denominator:
Both are just directed path graphs.
So, in essence, knowledge can be thought of as a graph — a knowledge graph (KG) [1],[2], where things are nodes that are connected with other things through mental associations.
Since this is my first post in 2026, after a two-month break, why not create a graph of knowledge embodied in my posts in 2025?
That immediately makes me ponder three questions:
- What would such a graph look like “on paper”?
- How would one search it to find this common denominator?
- And, finally, how is such a graph helpful in reasoning?
Each question demands attention, and so the story will be divided into three chapters — three separate posts — investigating representation, retrieval, and reasoning.
This post focuses only on representation — construction of the graph itself; retrieval and reasoning will follow in subsequent posts. And while I know the ending of today’s chapter, I don’t know yet what is there to emerge in the follow-ups. Nevertheless, here we are, entering together the world of knowledge graphs to explore their appearance and use.
Come along as I explore this world and share my findings!
All code for graph construction and visualization is available in a public GitHub repository: https://github.com/storiesinstructure/knowledge_graphs.
What I want to achieve
The idea I have in mind is simple: take my blog posts of 2025 and transform them into a knowledge graph.

In other words: take a bunch of messy written text and transform it into nodes, that clearly must represent something, and edges, that connect these nodes for some undisclosed reason.
Let’s untangle this mystery step by step.
At first, I wondered, what would I even imagine this graph to contain?
What does my Wrapped 2025 graph contain?
If knowledge is a graph, then the first practical question unavoidably becomes: what exactly should exist in that graph?
In my previous posts, the meaning of nodes and edges was simple. For example, when investigating Santa’s journey over European sky to deliver Christmas presents, nodes represented waypoints, and edges represented airway segments. The graph interpretation was tightly tied to a physical structure.
Here, however, we deal with a conceptual structure, and that means we have to decide on our own:
- what kind of nodes exist,
- what kind of edges exist,
- and what those types mean.
This explicit definition of what types of entities exist and how they relate to one another is called an ontology.
I thought: what if we had two such ontologies, both describing knowledge embodied in my posts, but focused on different aspects?
Conceptual Ontology
The first ontology I considered is focused on concepts, such as paths or graph traversal, and how they relate to one another.
Each post explored several such concepts. That gives us two entity types: Post and Concept, and the relationship: Post → explores → Concept.
Some concepts were related to one another, either in the same post or across posts. That can be expressed with Concept → related_to → Concept.
Sometimes, as in the above example with the connection between scanpaths and climbing routes, two or more concepts have a common abstraction. That brings my last relation of Concept → abstracts_to → Abstraction.
## Conceptual ontology
Purpose: Surface recurring abstractions across domains.
Node types:
* Post
* Concept (path, traversal, constraint, visibility, locality)
* Abstraction (directed graph, flow, connectivity)
Relations:
* Post → explores → Concept
* Concept → abstracts_to → Abstraction
* Concept → related_to → ConceptNarrative Ontology
The second type of ontology that I imagined was focused on narration. Think of it as of a selection of storytelling tools that make a story.
Each post is tackling a specific problem, like: “I want to reconstruct the structure of my 2025 writing”.
The problem builds tension. The current tension could be phrased as “If knowledge is graph-like, how do I even begin to construct a meaningful graph from messy prose?”
Then, the tension is resolved, everybody starts to breathe again and smile at one another. Unlike the conceptual ontology, which captures what is being discussed, this ontology focuses on how the story unfolds and on the emotions of a reader. Tension brings uncertainty, anticipation, curiosity, desire for meaning. It is released when the reader’s need for resolution is satisfied: a mystery is explained, conflict ends, or a decision is made. Hence, Tension → resolved_by → Resolution.
Finding the resolution also concludes the post.
This reasoning results in the following ontology:
## Narrative ontology
Purpose: Capture how things are explained.
Node types:
* Post
* Problem
* Tension
* Resolution
Relations:
* Post → introduces → Problem
* Problem → leads_to → Tension
* Tension → resolved_by → Resolution
* Post → concludes_with → ResolutionAre my ontologies any good?
Having constructed this narrative ontology, I was still experiencing a lot of uncertainty. Shouldn’t I have a story as a top entity, instead of the post? Shouldn’t there be a direct relationship between the post and the tension?
And I don’t know the right answers yet.
I decided to leave the ontologies as they are, instead of making them “perfect”, and I expect that my further investigation on retrieval and reasoning (in the two follow-up posts) will lift the veil.
For now, I’ve established the types of nodes and edges, as well as their meaning. The next step is to construct the actual graphs and see what structure emerges.
First Attempt: Greedy Graph
To start, I needed to extract entities and relationships from text.
I cut my posts into ~2000-character fragments (roughly paragraph-sized). Then, I handed each piece and an ontology description to a Large Language Model (LLM). The LLM’s job was to find entities (nodes) and relationships (edges) whose types appear in the ontology. This means that the LLM was not allowed to invent any new types. At the end, I added Post nodes programmatically: each post is connected to the entities extracted from its text.
For each ontology I got a graph. Knowing that my posts discussed intertwined ideas, I expected a lot of edges that link one post to another.
To my surprise, I saw very little of these connections in the conceptual graph (Fig. 1)!
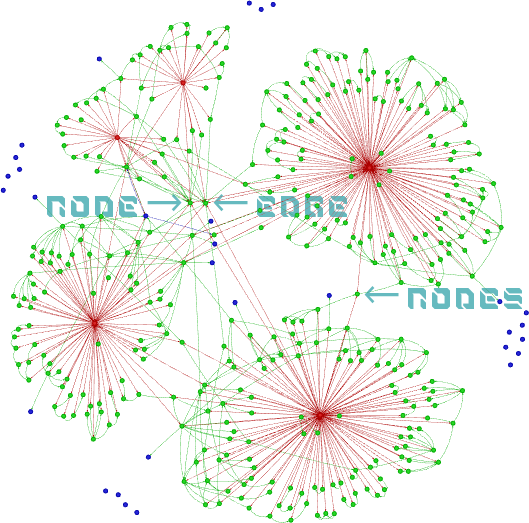
Figure 1. Knowledge graph constructed with conceptual ontology from my 2025 blog posts. Nodes: red - posts, green - concepts, blue - abstractions.
The most connected Concepts were those of “Node” and “Edge”, which is not surprising since I used these exact words in my every post. That also shows that when exactly the same words were used across my posts, these were unified during the graph construction.
But I wasn’t satisfied! I would want the “Nodes” Concept node to be unified with the “Node” one. Yet, it wasn’t. There were obvious duplicates in my graph!
The second problem I spotted are blue Abstraction nodes that are floating around, disconnected from Concepts and without a direct connection with any Post. In my conceptual ontology, Abstraction was supposed to be above the Concept , which I modelled with the relation Concept → abstracts_to → Abstraction.
Having Abstraction nodes floating around means they can’t be reached from a post or concept during traversal.
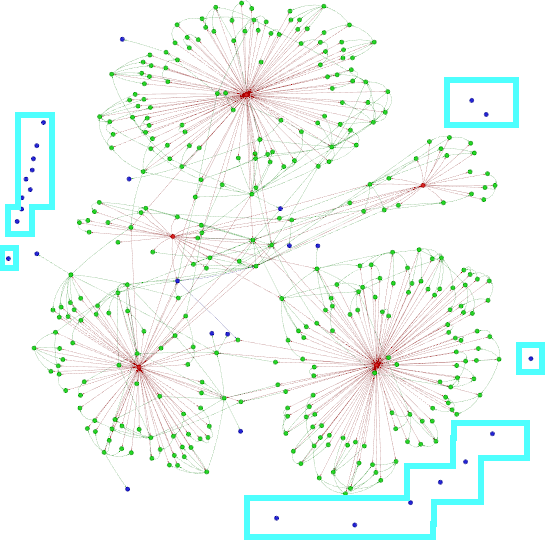
Figure 2. Most of the Abstraction nodes in the conceptual graph (marked with cyan boxes) are disconnected from the main graph component.
Before we move on, let’s have a look at the narrative graph (Fig. 3), because it is even more disconnected. The graph is made of five large components (i.e. parts of a graph that are fully separated from the rest of the graph) and three disconnected nodes (which, technically, are also graph components).

Figure 3. Knowledge graph constructed with narrative ontology from my 2025 blog posts. Nodes: red - posts, green - problems, cyan - tensions, purple - resolution.
Zooming into one post, Climbing Routes are Graphs, there were four (green) problems identified, each producing its (cyan) tension, and resolved with a (purple) resolution.
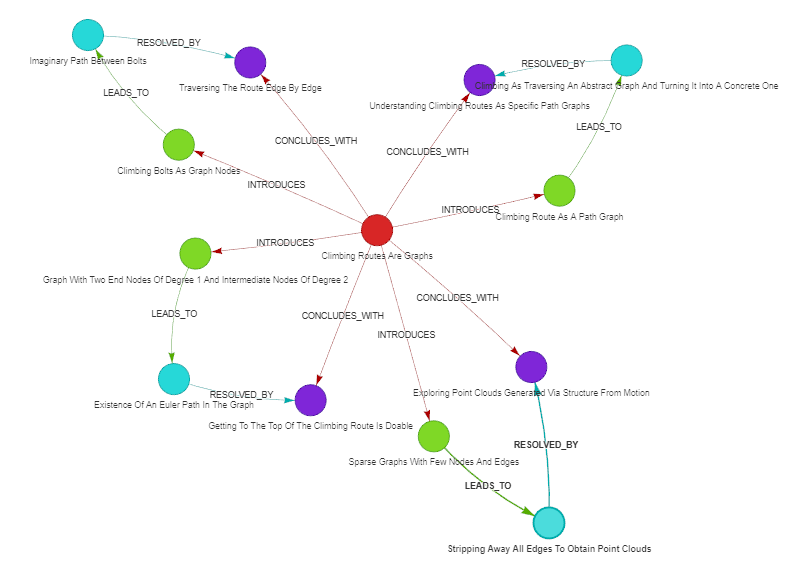
Figure 4. Narrative graph component of the “Climbing Routes Are Graphs” post. Nodes: red - post, green - problem, cyan - tension, purple - resolution.
Summarizing my first attempt: I achieved the goal of creating a graph from my blog posts, but I’m far from satisfied with the results. Maybe it’s the duplicates that mess things up?
Second Attempt: Deduplicated Graph
The hypothesized major culprit were the duplicates.
To deduplicate, for each entity type (Concept, Tension, Problem, etc.), I sent the list of node names to the LLM, with the task to identify groups that are true duplicates (e.g. “SfM” and “Structure from Motion”). LLM picks a canonical name for each group, and the graph is rewired so that the edges point to the new node. Finally, old duplicated nodes are removed.
This process is called entity resolution, as it groups together entities with the same meaning, or canonicalization, as in addition to grouping — a new, canonical / standard name is assigned.
What is the visual effect of this canonicalization?
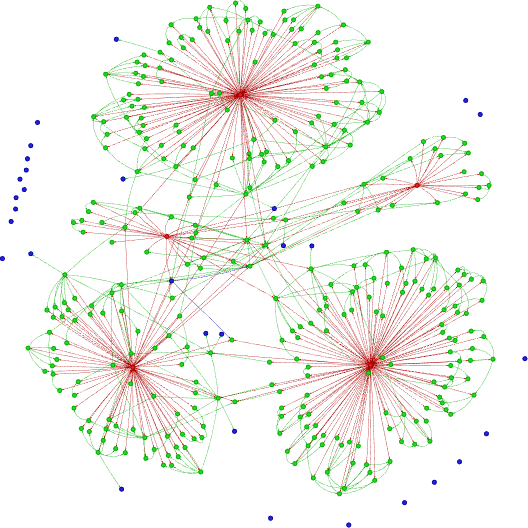
Figure 5. Canonicalized knowledge graph constructed with conceptual ontology from my 2025 blog posts. Nodes: red - posts, green - concepts, blue - abstractions.
The structure is still composed of five large components (each corresponding to a blog post), but now they are much more connected and the graph has become more spatial.
Revising a few examples of what has been merged, I’m also satisfied. See for yourselves: a new canonical name is to the left, and all merged-and-replaced nodes are to the right:
Graph Without Edges ← Point Cloud, Sparse Point Cloud, Graph Without Edges
Photos ← Photo, Photos, Few Photographs, Photographs, Additional_Photos, Set Of Flat Images
Waypoint ← Waypoint, Waypoints, Named Waypoints
The narrative graph has also improved. Posts share either a tension or a resolution, and in some cases tensions have been unified into one. For example, in How to Solve a House Puzzle, the problem of drawing a house and the problem of finding a route through all the bridges of Königsberg lead to the same tension of “Existence of an Euler Path in the Graph”.
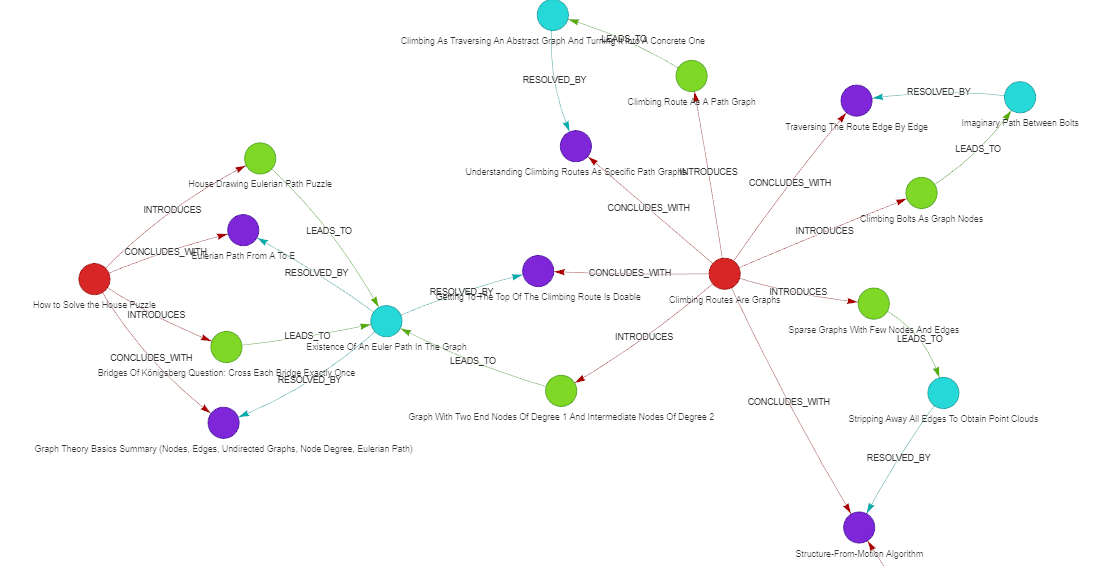
Figure 6. Canonicalized narrative graph neighborhood of the “Climbing Routes Are Graphs” post node. Nodes: red - post, green - problem, cyan - tension, purple - resolution.
Summarizing my second attempt: Deduplication fixed the obvious so the graph can actually connect. However, that hasn’t solved the problem of floating abstractions.
Third attempt: Hierarchical aggregation
Why did I want abstractions?
That’s a valid question to ask. I was curious what knowledge is captured in my knowledge graph without diving into details. I believe I’m not alone with the urge to have a summary or means to grasp a general idea.
Although the LLM did not succeed in linking Abstraction to Concept nodes, the hunch persists: there are groups of nodes that have something in common.
Are these groups visible in the structure of the graph itself?
I applied Louvain community detection algorithm [3] (community = dense group of nodes), and handed the results over to the LLM to summarize. That resulted in 61 communities being found in the conceptual graph:
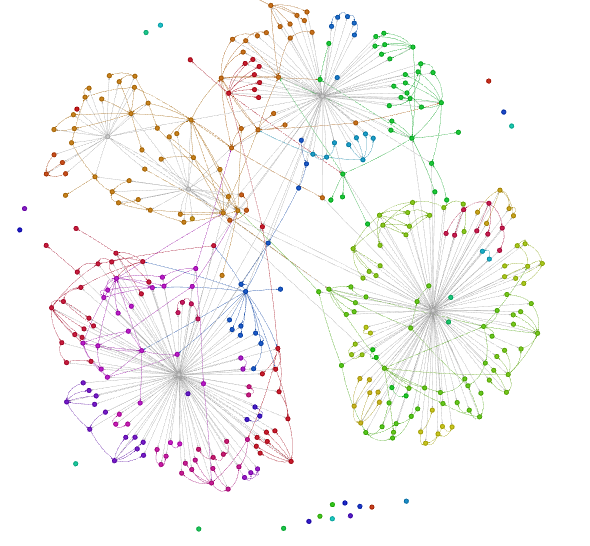
Figure 7. Communities detected in the canonicalized conceptional graph. 337 Concept nodes and 30 Abstraction nodes were grouped into 61 communities, ranging from one member to the maximum of 35 nodes (Community 6).
Zooming in again into a single post, “Climbing Routes are Graphs”, almost all the Concept nodes associated with this post were put into one community, grouping together notions around path graphs and Eulerian path existence, like so:
Community 6 (35 members)

This community links concepts from graph theory—especially Eulerian paths, node degrees, and classic problems like the Bridges of Königsberg—with analogies from rock climbing and physical structures, using routes, ropes, bolts, bridges, and airways to illustrate graphs, edges, vertices, and traversals in an intuitive, real-world way.
In the narrative graph, nodes associated with the “Climbing Routes are Graphs” post, form four communities concentrated around four different areas:
- Community 0 (3 members) models a rock climbing route as a graph problem
- Community 1 (7 members) centers on understanding and determining the existence of an Eulerian path in a graph
- Community 2 (3 members) frames climbing as the process of turning an abstract graph of possible movements into a concrete path
- Community 3 (3 members) represents the modeling of visual data as sparse graphs
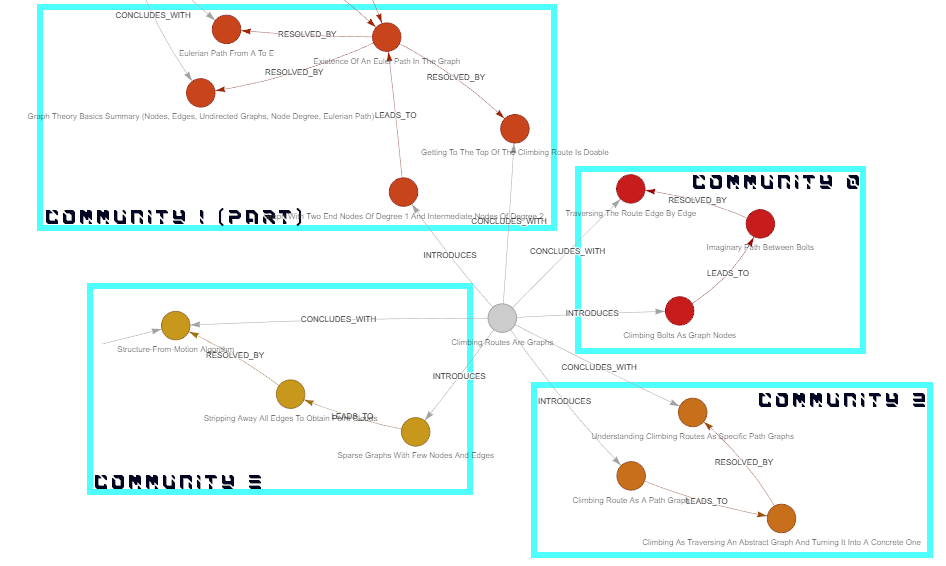
Figure 8. Four communities detected in the neighborhood of the “Climbing Routes Are Graphs” post node, in the canonicalized narrative graph.
Clearly, communities are the way to summarize local groups of nodes, and so each post can be briefly summarized by its communities.
Communities, however, are still not able to capture that “eye scanpath” in one post and “directed path graph” in another post are both subtypes of “directed graph”, unless it is explicitly stated in the text.
Third attempt summarization: Summarization - achieved, generalization - not yet.
Fourth attempt: Generalization with hypernyms
Let me cite myself :D
Communities, however, are still not able to capture that “eye scanpath” in one post and “directed path graph” in another post are both subtypes of “directed graph”, unless it is explicitly stated in the text.
What that means is that:
- “eye scanpath” IS A “directed graph”
- “directed path graph” IS A “directed graph”
- but if I never said it explicitly in the text, the connection will NOT appear in the graph.
It is telling us something: the hierarchy doesn’t live in the text.
The hierarchy lives in domain knowledge.
My blog talks about specific concepts, sometimes it mentions an abstraction, but oftentimes the generalizations are implied, not stated.
So if I want to have hierarchical structure and some “super” nodes that group several concepts together into a broader domain, I have to impose this hierarchy.
Using LLM, I grouped nodes of each type into “broader conceptual categories that the members are instances or subtypes of”. The LLM was free to come up with the name and the scope of these broader conceptual categories.
Effectively, I asked the LLM to cluster nodes and find a hypernym for each cluster (e.g. animal is a hypernym of elephant). Every node in a cluster is connected with IS_A edge to the cluster’s hypernym.
The problem originated in the conceptual ontology, but actually it is easier to visualise the outcome in the narrative graph.
For three separate Problem nodes related to sparse spatial graphs, we got a new Problem super-node “Sparse graphs, point clouds, and spatial neighborhoods”, that generalizes these three problems and also creates a new link between two posts.
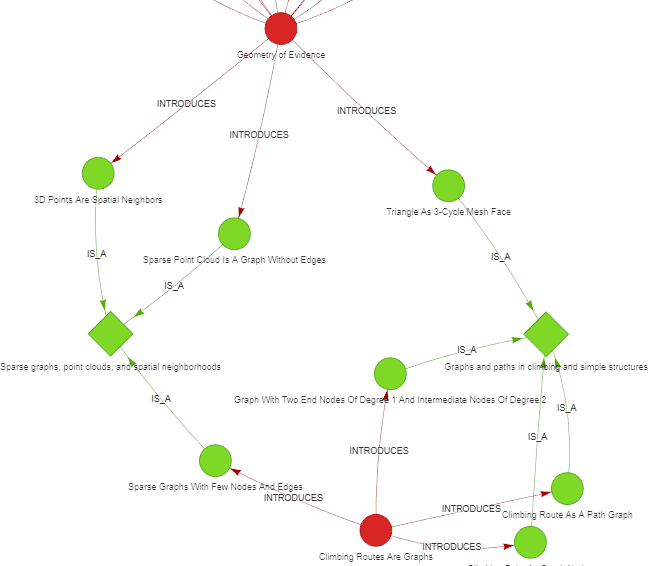
Figure 9. Problems (round green nodes) and super-problems (rhombus green nodes) in the narrative graph, showing that several problems are sub-problems of a broader one. A broader problem may be discussed by more than one post (red nodes).
Similarly, for six separate Resolutionnodes, we got a new Resolutionsuper-node “Graph theory and path representations”, that generalizes these six resolutions and also creates a new link between four posts.
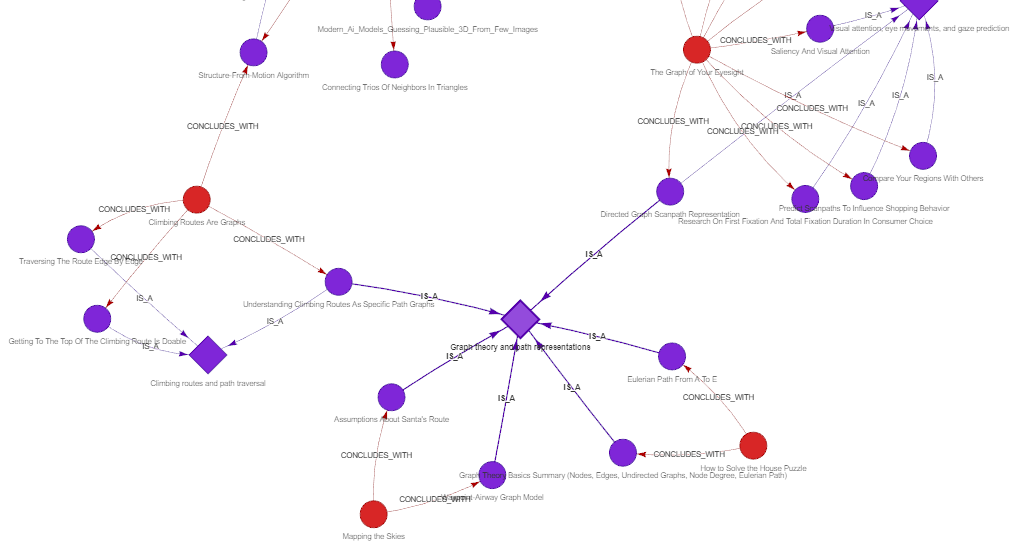
Figure 10. Resolutions (round purple nodes) and super-resolutions (rhombus purple nodes) in the narrative graph, showing that several resolutions are sub-resolutions of a broader one. A broader resolution may release tensions that arose in more than one post (red nodes).
While I couldn’t find the “directed graph” super-node, the generalization I obtained with hypernyms is close enough to what I envisioned.
Interestingly, investigating both, communities and hypernyms, allowed us to see different approaches to “zooming out” on the graph. Communities are based on edge density, so purely on the structure of the graph, whereas hypernyms are semantic — based on conceptual hierarchy.
Conclusion
I didn’t begin with a neatly defined pipeline. I began with a graph that didn’t look right. Each refinement step — deduplication, community detection, hierarchical grouping — emerged as a response to something that felt off.
But such a pipeline exists. The work of Darren et al. [4] defines the pipeline order for graph creation in GraphRAG (Graph Retrieval Augmented Generation): extract entities → resolve/merge duplicates → detect communities → summarize communities. Microsoft GraphRAG documentation [5] makes the pipeline even more explicit.
The biggest surprise was that structure doesn’t automatically “live in the text” and one has to decide where it comes from. Additionally, what felt natural to me (hypernyms) is not a common practice in the GraphRAG pipeline. That makes me wonder about the consequences of both designs for search and information retrieval.
Finally, what I find delightful is that we constructed a graph from texts that themselves explore graphs!
In my follow-up posts, I’ll treat these graphs as a retrieval layer and test what questions they answer.
References
[1] Quillian, M. Ross. “The teachable language comprehender: A simulation program and theory of language.” Communications of the ACM 12.8 (1969): 459-476. https://dl.acm.org/doi/abs/10.1145/363196.363214
[2] Quillian, M. Ross. “Word concepts: A theory and simulation of some basic semantic capabilities.” Behavioral science 12.5 (1967): 410-430. https://onlinelibrary.wiley.com/doi/abs/10.1002/bs.3830120511
[3] Traag, Vincent A., Ludo Waltman, and Nees Jan Van Eck. “From Louvain to Leiden: guaranteeing well-connected communities.” Scientific reports 9.1 (2019): 5233. https://www.nature.com/articles/s41598-019-41695-z
[4] Edge, Darren, et al. “From local to global: A Graph RAG approach to query-focused summarization.” arXiv preprint arXiv:2404.16130 (2024). - https://arxiv.org/abs/2404.16130
[5] Microsoft GraphRAG documentation https://microsoft.github.io/graphrag/index/default_dataflow/